Managing design projects & config files
Working with design projects
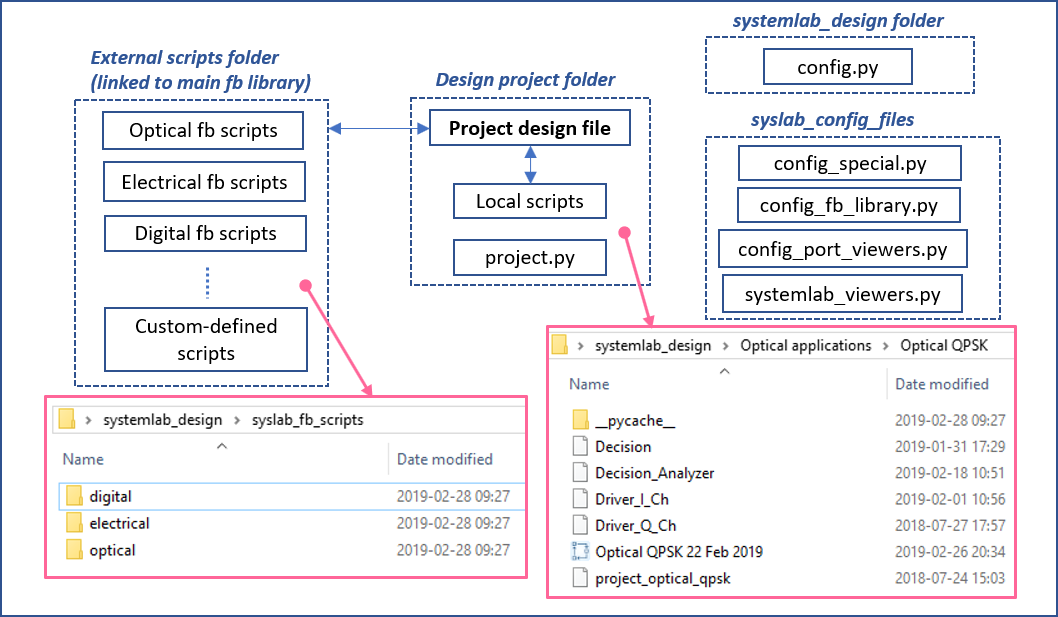
All projects begin with a project design file which holds the 2D layout for a design concept or prototype. It is maintained in binary format (using Python’s pickle method) and can be built, opened, edited and saved from the SystemLab|Design application. The file is identified from the suffix *.slb (slb = systemlab binary).
In the beginning stages of a project, only one project design file may be needed but as the design evolves, additional files may be required. These could include one or more project design files, custom script modules, data files, and a project.py module. It is thus recommended to manage your design projects by creating dedicated folders for each project, application or design (this also simplfies project file path management!)
About SystemLab|Design binary files…
SystemLab|Design project files are saved into a compact binary format through byte stream serialization (using Python’s pickle method). The files are non-human readable and can only be re-opened (de-serialized) from a SystemLab|Design application. Protocol version 3 of pickle is used to ensure compatibility with future versions of Python 3.x.
Each functional block must be linked to a script module. Script modules can be accessed from the Functional block library script folders and/or from folder locations specified within the Project settings for the design file. For scripts that are specific/custom to a given design project it is highly recommended to house these directly within its associated design project folder.
A project.py module can also be included in the design project folder. Though not obligatory, this module can be used to define global settings that can be shared between functional blocks during a simulation.
Overview of config files
The SystemLab|Design distribution bundle includes configuration files which can be used to define and manage classes, methods, and variables linked to:
The functional block library tree menu (config_fb_library.py)
Custom graph and viewer objects (systemlab_viewers.py)
Port viewer configuration settings (config_port_viewers.py)
Specialized settings (config_special.py)
Overview of the functional block library tree menu structure - config_fb_library.py
The config_fb_library.py Python file is used to define the structure and content of the Functional block menu tree (located in the left section of the main application interface). It also contains the file path definitions for the scripts that are linked to each of the functional blocks in the library menu:
scripts_path_list = []
optical_scripts = '\\syslab_fb_scripts\\optical\\'
electrical_scripts = '\\syslab_fb_scripts\\electrical\\'
digital_scripts = '\\syslab_fb_scripts\\digital\\'

scripts_path_list.append(optical_scripts)
scripts_path_list.append(electrical_scripts)
scripts_path_list.append(digital_scripts)
The default folders (included with the release) contain the functional block scripts for optical, electrical and digital based elements. Additional script folders can be added as needed by updating this section of the file.
The structure and content of the functional block library are defined through Python lists. For example, the Optical section of the library is defined using the following section of code:
'''Functional block library===============================================================
'''
# The baseline sections are optical, electrical & digital. Sections, groups and members
# can be modified (incl. addition or deletion of any of these items)
library_title = 'Functional block library (1)'
library_main_w = 180
library_main_h = 350

# OPTICAL=================================================================================
# Section title, RGBT numbers, Expanding (boolean)
optical_group_properties = ['Optical', 170, 0, 0, 25, True]
optical_group  = []
optical_titles = ['Sources/Transmitters', 'Modulators', 'Detectors/Receivers',
                  'Passive devices', 'Active devices']

opt_sources_transmitters = ['CW Laser', 'Noise Source - Optical']
opt_modulators = ['Mach-Zehnder Modulator']
opt_detectors_receivers = ['PIN-APD Detector']
opt_passive_devices = ['Optical Attenuator', 'X-Coupler (uni-dir)', 'X-Coupler (bi-dir)',
                       'Optical Splitter', '90 Deg Optical Hybrid']
opt_active_devices = ['Optical Amplifier']

optical_group.append(optical_titles)
optical_group.append(opt_sources_transmitters)
optical_group.append(opt_modulators)
optical_group.append(opt_detectors_receivers)
optical_group.append(opt_passive_devices)
optical_group.append(opt_active_devices)
All Optical functional blocks are held in sub-group lists (Sources/Transmitters, Modulators, etc.) which are then appended to the primary list optical_group. Each sub-group list can be easily modified (functional block names can be removed, added or renamed as required) along with the sub-groups themselves (new sub-groups can be created, or existing ones can be re-named or deleted). This provides for full flexibity in organizing the way that the functional block tree menu is presented in the main application interface.
There are currently three groups defined for optical, electrical and digital based functional blocks and are combined together as follows:
# Combine all groups
fb_sections = [optical_group, electrical_group, digital_group]
fb_sections_properties = [optical_group_properties, electrical_group_properties,
                          digital_group_properties]
If required, new groups (with associated sub-groups) can be added to the fb_sections list.
Important
Each functional block name, defined the sub-group lists, must match in name to a SystemLab|Design binary file that is located under the “syslab_fb_library” folder. Its name must also be unique. To learn how to modify the contents of the Functional block library menu (and edit the associated config_fb_library.py file) see How to add a functional block to the library
Overview of custom graphs and viewers configuration file - systemlab_viewers.py
The systemlab_viewers.py Python file is used to declare QDialog classes that represent custom graphs which can be imported and instantiated within any functional block script. New classes can be added by copying and pasting from existing classes in this file. An example class, for x-y plotting, is shown below (this class is currently used for the QPSK Electrical model):
class IterationsAnalyzer_QPSK(QtWidgets.QDialog, Ui_Iterations_Analysis):
'''
Linked to: Electrical applications/QPSK Design/QPSK Design 22 Feb 2019
Tab objects (QWidget) are named "tab_xy", "tab_xy_2", etc.
Graph frame objects (QFrame) are named "graphFrame". "graphFrame_2", etc.
'''
def __init__(self, data_x_1, data_y_1, data_x_2, data_y_2):
    QtWidgets.QDialog.__init__(self)
    Ui_Iterations_Analysis.__init__(self)
    self.setupUi(self)
    syslab_icon = set_icon_window()
    self.setWindowIcon(syslab_icon)
    self.setWindowFlags(self.windowFlags()|QtCore.Qt.WindowMinimizeButtonHint)
    self.iteration = 1
    self.data_x_1 = data_x_1
    self.data_y_1 = data_y_1
    self.data_x_2 = data_x_2
    self.data_y_2 = data_y_2

    #Setup background colors for frames
    p = self.graphFrame.palette()
    p.setColor(self.graphFrame.backgroundRole(), QtGui.QColor(252,252,252))
    self.graphFrame.setPalette(p)
    p2 = self.graphFrame_2.palette()
    p2.setColor(self.graphFrame_2.backgroundRole(), QtGui.QColor(252,252,252))
    self.graphFrame_2.setPalette(p2)

    #Setup matplotlib figures and toolbars
    self.graphLayout = QtWidgets.QVBoxLayout()
    self.figure = plt.figure()
    self.canvas = FigureCanvas(self.figure)
    self.toolbar = NavigationToolbar(self.canvas, self.tab_xy)
    self.graphLayout.addWidget(self.canvas)
    self.graphLayout.addWidget(self.toolbar)
    self.graphFrame.setLayout(self.graphLayout)

    self.tabData.setCurrentWidget(self.tab_xy)
    self.tabData.setTabText(0, 'SER results')

    self.figure.tight_layout(pad=0.5, h_pad = 0.8)
    self.figure.set_tight_layout(True)
    self.plot_xy()
    self.canvas.draw()

def plot_xy(self):
    ax = self.figure.add_subplot(111, facecolor = '#f9f9f9')
    ax.clear()
    ax.plot(self.data_x_1, self.data_y_1, color = 'blue', linestyle = '--',
                linewidth= 0.8, marker = 'o', markersize = 3)
    ax.plot(self.data_x_2, self.data_y_2, color = 'black', linestyle = '-',
                linewidth= 0.8, marker = 'o', markersize = 3)

    ax.set_title('SER results QPSK')
    ax.set_xlabel('SNR per symbol (dB)')
    ax.set_ylabel('Symbol error rate')
    ax.set_yscale('log')
    ax.set_aspect('auto')
    ax.grid(True)
    ax.grid(which='major', linestyle=':', linewidth=0.5, color='gray')
    ax.minorticks_on()
    ax.grid(which='minor', linestyle=':', linewidth=0.5, color='lightGray')

'''Close event====================================================================='''
def closeEvent(self, event):
    plt.close(self.figure)
The plots/figures are built using the popular graphical tool kit matplotlib (which is included in the SystemLab|Design distribution package) and are integrated into Qt-based dialog classes (based on PyQt5) to provide access to a wide range of GUI object features such as frames, multiple tab dialogs, data fields, check boxes, etc.
To learn how to add customized graphs to your design project (and edit the associated systemlab_viewers.py file) see How to add a customized graph to a design project
Overview of the port viewer configuration settings - config_port_viewers.py
The config_port_viewers.py file can be used to change the default plot settings of the Optical, Electrical, Digital, and Analog signal port viewers. Several matplotlib parameters can be defined including line style, line width, line color, marker size/color, grid styles, background colors and axes settings. Example settings for the time domain tab of the Optical signal data viewer are shown below:
# Optical port viewer----------------------
optical_frame_background_color = '#f9f9f9'
# Time-domain tab (data plots)
optical_time_fig_back_color = '#f9f9f9'
optical_time_plot_back_color = '#f9f9f9'
optical_time_labels_axes_color = 'black'
optical_time_signal_color = 'b'
optical_time_signal_linestyle = '--'
optical_time_signal_linewidth = 0.8
optical_time_signal_marker = 'o'
optical_time_signal_markersize = 3
optical_time_noise_color = 'r'
optical_time_noise_linestyle = '--'
optical_time_noise_linewidth = 0.8
optical_time_noise_marker = 'o'
optical_time_noise_markersize = 3
optical_time_sig_noise_color = 'g'
optical_time_sig_noise_linestyle = '--'
optical_time_sig_noise_linewidth = 0.8
optical_time_sig_noise_marker = 'o'
optical_time_sig_noise_markersize = 3
optical_time_phase_color = 'y'
optical_time_phase_linestyle = '--'
optical_time_phase_linewidth = 0.8
optical_time_phase_marker = 'o'
optical_time_phase_markersize = 3
To change any port signal viewer settings, select Edit/Port viewers config file/Edit from the Menu bar. Once your updates are complete, save and close the SciTE editor window and select Edit/Port viewers config file/Reload from the Menu bar to re-import the module into the SystemLab|Design application (the new settings will now be in place!)
Overview of the specialized settings for SystemLab|Design - config_special.py
The config_special.py file can be used to change various settings in the SystemLab|Design application interface. These include the color settings for signal types, hover display settings for functional blocks and ports, etc. A summary of the current settings are shown below:
"""
SystemLab-Design 19.12.r1
Configuration file for various settings
Version: 1.0 (15-Nov-2019)
"""

'''Color settings for signal types (functional block ports and signal links)===========
Refs: https://doc.qt.io/qt-5/qcolor.html#details, https://www.colorhexa.com
'''
c_elec = [0, 0, 225] # Electrical signal (blue)
c_opt = [139, 0, 0] # Optical signal (dark red)
c_digital = [150, 150, 150] # Digital signal (gray)
c_analog_1 = [139, 0, 0] # Analog signal 1 (dark green)
c_analog_2 = [139, 0, 139] # Analog signal 2 (dark magenta)
c_analog_3 =  [0, 139, 139] # Analog signal 2 (dark cyan)
c_disabled =  [220, 220, 220] # Disabled (light gray)

'''Hover display settings (functional block/ports)=====================================
'''
display_fb_results_tool_tip = True # Display results for functional block (on hover)
display_fb_dim_coord_tool_tip = True # Display fb coordinates (on hover)
display_port_results_tool_tip = True # Display results for port object (on hover)

'''Highlight connections (signal links)================================================
'''
highlight_links_on_hover = False #Highlight signal path on hover enter or move event

'''Functional block (left-double click)================================================
'''
open_script_on_left_double_click = False # Opens script after left double-clicking on fb
                                         # Default opens fb properties
To change any of the specialized settings, select Edit/Config special file/Edit from the Menu bar. Once your updates are complete, save and close the SciTE editor window and select Edit/Config special file/Reload from the Menu bar to re-import the module into the SystemLab|Design application (the new settings will now be in place!)