How to add data panels to a design
In the following tutorial, we will add Data panels to an existing example design.
Note
A completed version of this design (including the updated “config_data_panels.py” file) can be found within the folder “systemlab_design\systemlab_examples\optical\optical_direct_detection_completed"
Part 1: Open the design projects “QPSK Design” and “Optical transmission IM”
Launch a new application of SystemLab|Design by double left-clicking on the SystemLab-Design.exe executable file.
From the Menu bar, select File/Open project and navigate to the folder “systemlab_design\systemlab_examples\optical\optical_direct_detection”
Select the design project “Optical transmission IM” (it will have a suffix “.slb”) and click on the Open button.
From the Menu bar, select File/Open project and navigate to the folder “systemlab_design\systemlab_examples\electrical\qpsk_design”
Select the project “QPSK Design” and click on the Open button.
Part 2: Add new data panel objects to the project design space
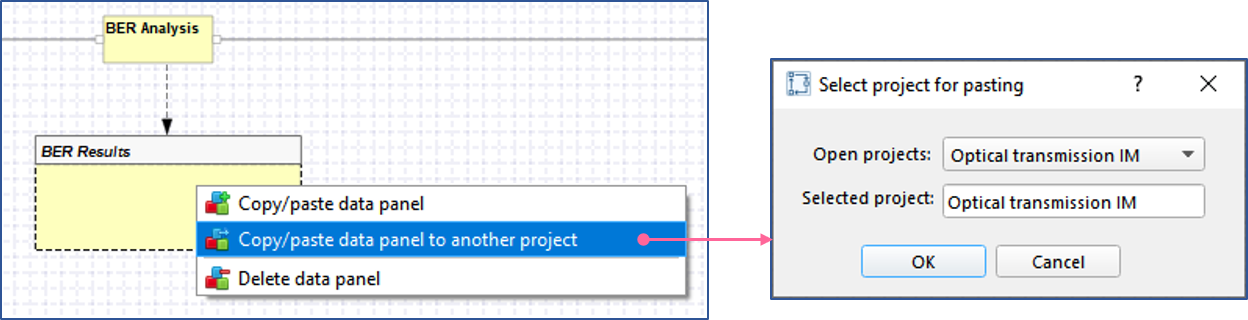
Within the “QPSK Design” project design space, hover over the data panel for BER Results and right-click and select Copy/paste data panel to another project.
Within the Select project for pasting dialog, select “Optical transmission IM” from the pull down menu and select OK. [A copy of the BER Results data panel will appear within the project design space for “Optical transmission IM”]
Close the design project “QPSK Design” by left-clicking on the Close tab (X icon next to the project name in the upper left tab for the project design space of “QPSK Design”).
Within the “Optical transmission IM” project design space, double left-click on the BER Results data panel item to open its Data panel properties dialog box (make sure to hover over the yellow (data section) region, as the title section will not activate the dialog).
In the data field for Data source file name change the text to: “opt_im_1”.
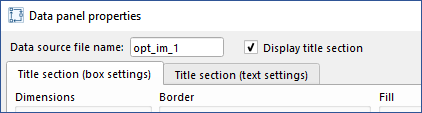
Select OK to save the save the changes and close the dialog.
Hover over the data panel for BER Results and right-click and select Copy/paste data panel.
Double left-click on the copied version of BER Results to open its Data panel properties.
In the data field for Data source file name change the text to: “opt_im_2”.
Select the Title section (text settings) tab and update the Title field to “Receiver Analysis”.
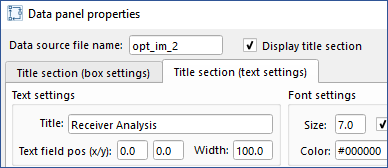
Select OK to save the changes and close the dialog.
Part 3: Update the fb_scripts for “BER Analysis” and “PIN-APD”
Double left-click on the BER Analysis functional block to open its properties panel.
Select the Edit script icon (next to Script module name) to view the script for “BER_Analysis_Opt_IM”.
Under the section for “RESULTS”, after ber_results (line 45), insert the following lines of code [In this section of code, four numerical results (from the CALCULATIONS section) are added to the data table list “opt_im_1”.]:
#Send update to data box (data_table_opt_im_1)
config.data_tables['opt_im_1'] = []
data_1 = ['Iteration #', iteration, '0.0f', ' ']
data_2 = ['Binary sequence length', binary_seq_length, 'n', ' ']
data_3 = ['Errored bits', err_count, '0.0f', ' ']
data_4 = ['Bit error rate', ber, '0.2E', ' ']
data_list = [data_1, data_2, data_3, data_4]
config.data_tables['opt_im_1'].extend(data_list)
Click on the Save icon in the Tool Bar to save all the changes.
Close the SciTE dialog (File/Exit)
Close the functional block properties for BER Analysis.
Double left-click on the PIN-APD functional block to open its properties panel.
Select the Edit script icon (next to Script module name) to view the script for “PIN_Model_Opt_IM”.
Below line 361 (pin_results list definition) insert the following lines of code:
'''==DATA PANEL UPDATE========================================='''
config.data_tables['opt_im_2'] = []
data_1 = ['Iteration #', iteration, '.0f', ' ']
data_2 = ['Received power (dBm)', rcv_pwr_dbm, '0.2f', ' ']
data_3A = ['Q (target)', Q_target, '0.1f', ' ']
data_3B = ['BER (target)', ber_target, '0.2E', ' ']
data_3C = ['Q (measured)', Q_measured, '0.2f', ' ']
data_4 = ['Optical receiver sensitivity (dBm)', pwr_sensitivity_dbm, '0.2f', ' ']
data_list = [data_1, data_2, data_3A, data_3B, data_3C, data_4]
config.data_tables['opt_im_2'].extend(data_list)
Click on the Save icon in the Tool Bar to save all the changes.
Close the SciTE dialog (File/Exit).
Close the functional block properties for PIN-APD.
Drag the data panel for Receiver Analysis and place it over the Decision Circuit functional block as follows (to drag scene items, left-click hold on the item to be dragged and left-click release once in the target postion)
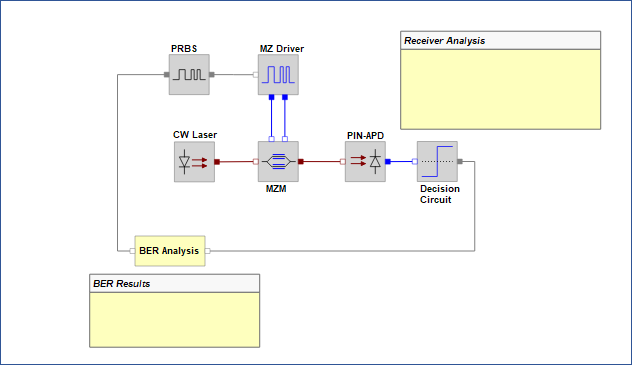
Fig 1: Copy/paste data panel to another project
Select the Save icon on the Tool bar of the main application to save all the changes made to the project design for “Optical transmission IM”.
Part 4: Run a simulation to test the operation of the data panels
On the Tool bar, select the Start button to initiate the simulator. [Data results should appear in both data panels as shown below.]
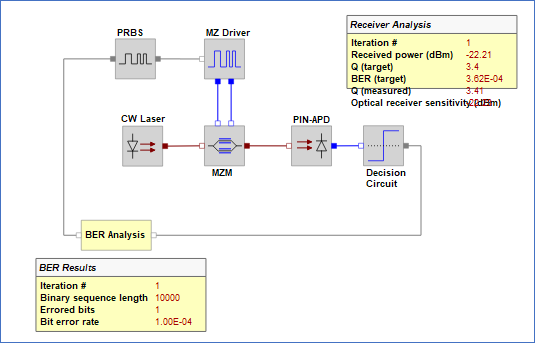
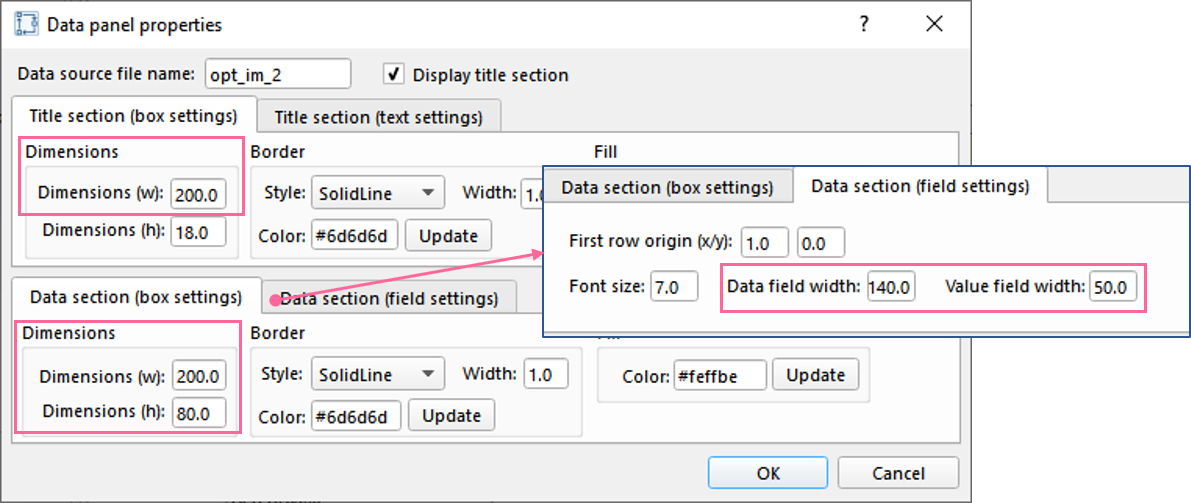
We see that the data results for the Receiver Analysis panel are exceeding the panel’s dimensions. To adjust the panel’s dimension settings, double left-click to open its properties and update the following data fields:
Under Title section (box settings) set Dimensions (w) to “200”.
Under Data section (box settings) set Dimensions (w) to “200” and Dimensions (h) to “80”.
Under Data section (field settings) set Data field width to “140” and Value field width to “50”.
Select OK to save all changes and to close the dialog.
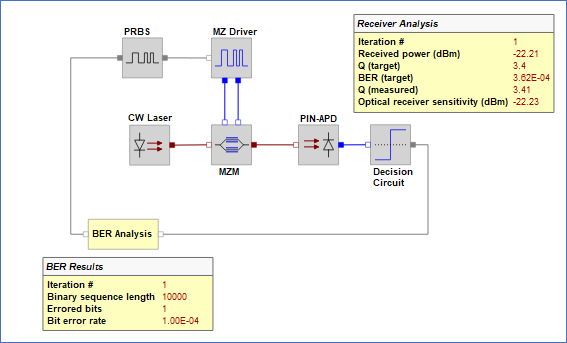
On the Tool bar, select the Start button to re-run the simulator. [The data panel dimensions should now be aligned with the results!]
This completes the tutorial on how to add data panels to a design!